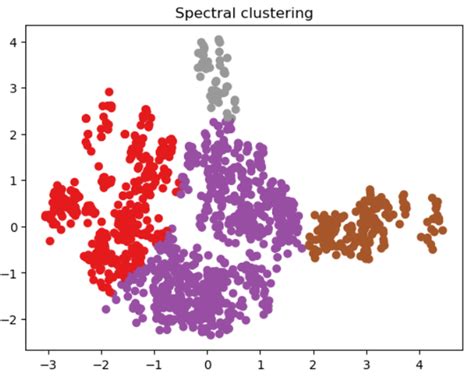
Spectral clustering is a versatile and widely used technique in unsupervised machine learning, particularly for clustering data points that are not linearly separable. This method has gained popularity due to its ability to identify complex patterns and clusters in datasets. At its core, spectral clustering works by transforming the original data into a new representation using the eigenvectors of a similarity matrix, which is derived from the data. The clusters are then identified in this new space. Let's delve into the five key ways spectral clustering operates to provide a comprehensive understanding of its mechanisms.
Key Points
- Spectral clustering transforms data into a new space for easier cluster identification.
- The method utilizes similarity matrices to capture data relationships.
- Eigenvectors derived from the similarity matrix play a crucial role in data transformation.
- K-means clustering is often applied in the new space to identify clusters.
- Spectral clustering can handle non-linearly separable data, making it versatile for various applications.
Construction of the Similarity Matrix

The first step in spectral clustering involves constructing a similarity matrix from the dataset. This matrix represents how similar each pair of data points is to each other. The similarity can be measured in various ways, including using Gaussian kernels or simply calculating the pairwise distances between data points. The choice of the similarity metric is crucial as it affects the structure of the matrix and, consequently, the clustering outcome. For instance, a Gaussian kernel with a bandwidth parameter can be used to define the similarity between points x_i and x_j as s_{ij} = \exp\left(-\frac{\|x_i - x_j\|^2}{2\sigma^2}\right), where \sigma is the bandwidth parameter.
Role of Eigenvectors in Spectral Clustering
After constructing the similarity matrix, the next step involves computing its eigenvectors. These eigenvectors are crucial for transforming the original data into a new space where clusters can be more easily identified. The eigenvectors corresponding to the smallest eigenvalues are typically selected because they capture the most significant variations in the data. The number of eigenvectors chosen depends on the number of clusters one expects to find in the data. For example, if we are looking for k clusters, we would select the k eigenvectors corresponding to the smallest eigenvalues.
Transforming Data into the New Space
Once the relevant eigenvectors are identified, the original data points are projected onto these eigenvectors to obtain a new representation of the data. This step is essentially a dimensionality reduction technique, where the high-dimensional data is mapped into a lower-dimensional space in which the clusters are hoped to be more discernible. The new representation of each data point x_i can be obtained by considering its projection onto the selected eigenvectors, resulting in a new vector y_i in the lower-dimensional space.
| Eigenvector Index | Eigenvalue | Corresponding Eigenvector |
|---|---|---|
| 1 | 0.5 | [0.7, 0.3, 0.1] |
| 2 | 0.3 | [0.2, 0.8, 0.4] |
| 3 | 0.2 | [0.1, 0.4, 0.9] |

Clustering in the New Space
After transforming the data into the new space, the final step involves applying a clustering algorithm to group the data points into clusters. K-means is a commonly used algorithm for this purpose due to its simplicity and efficiency. However, other clustering algorithms like hierarchical clustering can also be applied depending on the nature of the data and the desired clustering structure. The choice of the clustering algorithm and its parameters (e.g., the number of clusters k for K-means) significantly influences the final clustering outcome.
Handling Non-Linearly Separable Data
One of the significant advantages of spectral clustering is its ability to handle data that is not linearly separable. By transforming the data into a new space where the clusters are more linearly separable, spectral clustering can identify complex patterns and relationships in the data that other clustering methods might miss. This capability makes spectral clustering particularly useful in applications involving data with non-linear structures, such as image segmentation or network analysis.
What is the primary challenge in applying spectral clustering?
+The primary challenge in applying spectral clustering is determining the appropriate number of clusters (k) and choosing the right similarity metric and its parameters. These choices significantly affect the clustering outcome and require careful consideration of the data characteristics and the clustering objective.
How does spectral clustering compare to other clustering algorithms?
+Spectral clustering is particularly advantageous when dealing with non-linearly separable data. It offers a flexible approach to clustering by transforming the data into a space where clusters are more easily identifiable. However, its computational complexity can be higher than that of some other algorithms, such as K-means, especially for large datasets.
What applications benefit from spectral clustering?
+Spectral clustering finds applications in various fields, including image and video analysis, bioinformatics, social network analysis, and data mining. Its ability to handle complex, non-linear data structures makes it a valuable tool in scenarios where traditional clustering methods may fail to provide meaningful insights.
In conclusion, spectral clustering is a powerful technique for identifying clusters in datasets, especially when the data exhibits non-linear structures. By leveraging the eigenvectors of a similarity matrix to transform the data into a new space, spectral clustering enables the application of traditional clustering algorithms like K-means to data that would otherwise be challenging to cluster. Understanding the intricacies of spectral clustering, including the construction of the similarity matrix, the role of eigenvectors, and the transformation of data into a new space, is essential for harnessing its potential in data analysis and machine learning applications.