The sample proportion symbol, often denoted as "p̂" (p-hat), is a fundamental concept in statistics, used to estimate the population proportion based on a sample of data. Understanding and correctly applying the sample proportion symbol is crucial for making inferences about a population. Here, we'll explore five ways the sample proportion symbol is utilized in statistical analysis, highlighting its importance and versatility.
Introduction to Sample Proportion
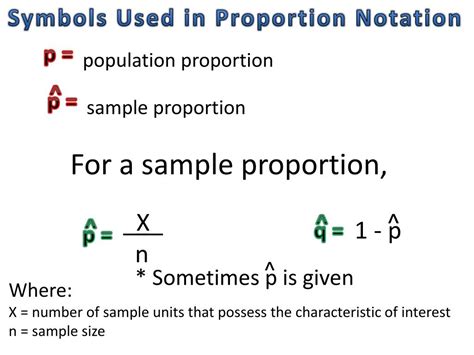
The sample proportion, represented by “p̂”, is calculated as the number of successes (or occurrences of a specific characteristic) in a sample divided by the total number of observations in the sample. It serves as a point estimate of the population proportion, “p”, and is essential for hypothesis testing and confidence interval construction. The formula for the sample proportion is p̂ = X / n, where X is the number of successes, and n is the sample size.
Key Points
- The sample proportion symbol "p̂" estimates the population proportion "p" based on sample data.
- It is calculated as the number of successes divided by the sample size (p̂ = X / n).
- Understanding the sample proportion is crucial for statistical inference, including hypothesis testing and confidence intervals.
- The sample proportion's accuracy depends on the sample size and the variability of the data.
- Statistical software and calculators can compute the sample proportion and related statistics efficiently.
Calculating Sample Proportion

To illustrate the calculation of the sample proportion, consider a quality control scenario where a manufacturer wants to estimate the proportion of defective products in a large batch. If a random sample of 100 products contains 8 defectives, the sample proportion of defective products would be p̂ = 8 / 100 = 0.08. This value estimates the population proportion of defective products and can be used for further statistical analysis.
Sample Proportion in Hypothesis Testing
One of the critical applications of the sample proportion is in hypothesis testing, particularly for tests concerning proportions. For instance, a company might want to test whether the proportion of customers who prefer a new product design is significantly higher than 50%. By calculating the sample proportion from a representative sample and using it in a hypothesis test (such as the z-test for proportions), the company can make informed decisions based on statistical evidence.
| Statistical Concept | Formula | Description |
|---|---|---|
| Sample Proportion | p̂ = X / n | Estimates the population proportion. |
| Z-score for Proportions | z = (p̂ - p) / sqrt(p(1-p)/n) | Used in hypothesis testing for proportions. |
| Margin of Error | E = z * sqrt(p̂(1-p̂)/n) | Important in confidence interval construction. |

Confidence Intervals for Proportions
Another significant application of the sample proportion is in the construction of confidence intervals for proportions. A confidence interval provides a range of values within which the true population proportion is likely to lie. The width of the interval depends on the sample proportion, the sample size, and the chosen confidence level. For example, a 95% confidence interval for a population proportion, based on a sample proportion of 0.08 from a sample of 100, can be calculated using the formula: p̂ ± z * sqrt(p̂(1-p̂)/n), where z is the z-score corresponding to the desired confidence level.
Sample Size Determination
Determining the appropriate sample size is crucial when aiming to estimate a population proportion with a certain level of precision. The formula for calculating the required sample size (n) for estimating a proportion involves the desired margin of error (E), the z-score corresponding to the confidence level, and the estimated proportion (p̂) if available: n = (z^2 * p̂ * (1-p̂)) / E^2. This highlights the importance of considering the sample proportion in the planning stages of a study.
What is the purpose of the sample proportion in statistics?
+The sample proportion serves as an estimate of the population proportion, allowing for inferences to be made about the population based on sample data.
How is the sample proportion calculated?
+The sample proportion (p̂) is calculated by dividing the number of successes (X) by the total number of observations (n) in the sample: p̂ = X / n.
What are the primary applications of the sample proportion in statistical analysis?
+The sample proportion is primarily used in hypothesis testing concerning proportions and in the construction of confidence intervals to estimate the population proportion.
In conclusion, the sample proportion symbol “p̂” is a cornerstone of statistical analysis, particularly when dealing with proportions. Its applications range from hypothesis testing to confidence interval construction, and understanding its calculation and interpretation is essential for making informed decisions based on data. By recognizing the significance of the sample proportion and its role in statistical inference, researchers and analysts can better navigate the complexities of data analysis and draw more accurate conclusions about the populations they study.