The P value table is a crucial component in statistical analysis, particularly in hypothesis testing. It provides a way to determine the significance of the results by comparing the calculated test statistic to a critical value or by calculating the probability (P value) of obtaining the results (or more extreme) assuming that the null hypothesis is true. In this guide, we will delve into the details of the P value table, its interpretation, and its applications in statistical analysis.
Understanding P Value Tables

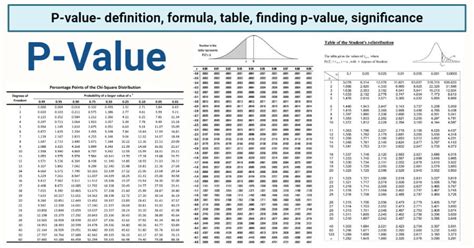
P value tables, also known as critical value tables or statistical tables, are pre-calculated tables that show the critical values for certain statistical tests. These tables are typically organized by the type of test (e.g., t-test, chi-square test), the degrees of freedom, and the significance level (α). The significance level is the threshold beyond which the null hypothesis is rejected, commonly set at 0.05.
Structure of P Value Tables
A typical P value table for a two-tailed test might include the following columns and rows:
- Test Statistic: This could be a t-score, z-score, chi-square value, etc., depending on the type of test.
- Degrees of Freedom (df): This varies depending on the test and the sample size. For a t-test, df = n - 1, where n is the sample size.
- Significance Level (α): Commonly 0.05, but can be adjusted based on the researcher’s requirements.
- Critical Value: The value from the table that the test statistic is compared against to determine significance.
| df | α = 0.05 | α = 0.01 |
|---|---|---|
| 1 | 6.314 | 31.821 |
| 2 | 2.920 | 6.965 |
| 3 | 2.353 | 5.841 |

Interpreting P Values

When conducting a statistical test, the P value is calculated based on the test statistic and the degrees of freedom. This value represents the probability of observing the results (or more extreme) if the null hypothesis is true. If the P value is less than the chosen significance level (α), the null hypothesis is rejected, indicating that the observed effect is statistically significant.
Example of P Value Interpretation
Suppose a researcher conducts a t-test to compare the means of two groups with a sample size of 10 in each group. The calculated t-score is 2.5, and the degrees of freedom (df) for this test are 18 (10 + 10 - 2). Looking at a t-distribution table for df = 18 and α = 0.05 (two-tailed), if the critical t-value is 2.101, the calculated t-score of 2.5 exceeds this critical value, indicating that the difference between the two groups is statistically significant at the 0.05 level.
Key Points
- The P value table is a tool used in hypothesis testing to determine the significance of results.
- Understanding the structure of the table, including degrees of freedom and significance levels, is crucial for correct interpretation.
- P values are used to reject or fail to reject the null hypothesis based on the chosen significance level.
- Interpreting P values requires considering the context of the research question and the potential for Type I and Type II errors.
- Statistical software can calculate P values directly, but understanding how to use P value tables can provide deeper insight into statistical analysis.
Applications and Limitations
P value tables have widespread applications in various fields, including medicine, social sciences, and engineering, wherever statistical hypothesis testing is required. However, the interpretation of P values and the use of P value tables must be done with caution, considering the limitations and potential pitfalls such as misinterpretation of P values, issues with sample size, and the potential for p-hacking.
Best Practices for Using P Value Tables
Best practices include choosing an appropriate significance level based on the research context, considering the power of the test, and being aware of the assumptions of the statistical test being used. Additionally, researchers should be cautious of p-hacking, where data is manipulated or selectively presented to achieve a desired P value.
What is the primary use of a P value table in statistical analysis?
+The primary use of a P value table is to determine the significance of the results by comparing the calculated test statistic to a critical value, thus helping in the decision to reject or fail to reject the null hypothesis.
How do I choose the correct degrees of freedom for a t-test?
+What is the difference between a one-tailed and a two-tailed test in terms of P value interpretation?
+A one-tailed test examines the possibility of an effect in one direction (e.g., an increase), while a two-tailed test considers effects in both directions (e.g., an increase or a decrease). The choice between them affects how the P value is interpreted and the critical value looked up in a P value table.
In conclusion, P value tables are indispensable tools in statistical hypothesis testing, allowing researchers to determine the significance of their findings. Understanding how to use these tables, along with the limitations and best practices for their application, is essential for conducting rigorous and meaningful statistical analysis.