The concept of normal table statistics is fundamental in understanding the distribution and behavior of data in various fields, including statistics, data analysis, and research. A normal table, also known as a z-table or standard normal distribution table, is a statistical tool used to determine the probability that a random variable with a normal distribution will fall within a certain range of values. In this overview, we will delve into the essentials of normal table statistics, exploring its definition, significance, and applications.
Definition and Significance of Normal Table Statistics

Normal table statistics is based on the standard normal distribution, which is a probability distribution that is symmetric about the mean, showing that data near the mean are more frequent in occurrence than data far from the mean. The standard normal distribution has a mean of 0 and a standard deviation of 1. This distribution is crucial because many statistical tests and analyses assume that the data follows a normal distribution or can be transformed to follow one. The normal table provides a way to calculate probabilities for a normally distributed variable, making it a cornerstone of statistical inference.
Understanding the Structure of a Normal Table
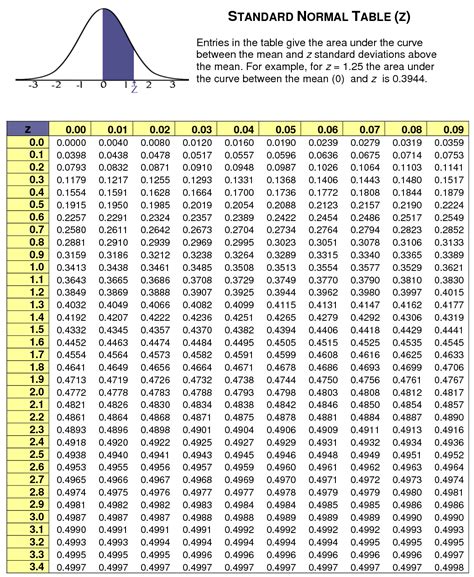
A normal table typically consists of rows and columns that represent different values of z-scores. A z-score is a statistical measure that describes how many standard deviations an element is from the mean. The rows in the table usually represent the whole number and the first decimal place of the z-score, while the columns represent the second decimal place. For instance, if you want to find the probability that a value is less than a certain z-score, you would look up the corresponding row and column in the table to find the probability value.
| Z-Score | Probability |
|---|---|
| 1.00 | 0.8413 |
| 1.50 | 0.9332 |
| 2.00 | 0.9772 |

Applications of Normal Table Statistics

Normal table statistics finds its application in various fields, including medicine, social sciences, and engineering, for hypothesis testing, confidence interval construction, and prediction. For example, in medicine, normal tables can be used to determine the probability of a patient’s test result being within a certain range, given the mean and standard deviation of the test results for a healthy population. In quality control, manufacturers use normal tables to monitor the production process, ensuring that the products’ characteristics are within the acceptable limits.
Limitations and Considerations
Despite its widespread use, normal table statistics has its limitations. One of the main assumptions is that the data follows a normal distribution, which might not always be the case. Non-normal data can lead to incorrect conclusions if analyzed using normal table statistics. Therefore, it’s crucial to check for normality before proceeding with analyses that assume normality. Additionally, with the advent of technology and statistical software, the need to manually look up values in a normal table has decreased, but understanding the underlying principles remains vital for interpreting results accurately.
Key Points
- The normal table is based on the standard normal distribution, which has a mean of 0 and a standard deviation of 1.
- Z-scores are used to find probabilities in a normal distribution, indicating how many standard deviations an element is from the mean.
- Normal table statistics is crucial for hypothesis testing, confidence intervals, and prediction in various fields.
- It's essential to check for normality of the data before applying normal table statistics.
- Understanding normal table statistics is fundamental for interpreting results from statistical analyses.
In conclusion, normal table statistics provides a powerful tool for analyzing and interpreting data under the assumption of normal distribution. Its applications are vast, and its understanding is fundamental for statistical analysis. However, it's also important to be aware of its limitations and always verify the assumptions before applying it to real-world problems.
What is the main use of a normal table in statistics?
+The main use of a normal table, or z-table, is to determine the probability that a random variable with a normal distribution will fall within a certain range of values. It helps in calculating probabilities for a normally distributed variable.
How do you interpret z-scores from a normal table?
+Z-scores from a normal table indicate how many standard deviations an element is from the mean. A positive z-score indicates that the element is above the mean, while a negative z-score indicates that it is below the mean. The table provides the probability that a value is less than the z-score.
What are the limitations of using normal table statistics?
+One of the main limitations is the assumption that the data follows a normal distribution. If the data is not normally distributed, using normal table statistics can lead to incorrect conclusions. It’s also important to consider that with the advancement of statistical software, manual lookup in tables is less necessary, but understanding the principles remains crucial.