The Z score, also known as the standard score, is a statistical measure that describes how many standard deviations an element is from the mean. It's a crucial concept in statistics, data analysis, and hypothesis testing. Calculating the Z score can be done in several ways, depending on the information available and the context of the problem. Here are five ways to get the Z score, each applicable to different scenarios and data types.
Key Points
- Understanding the formula and components required to calculate the Z score.
- Recognizing the different methods and tools available for Z score calculation.
- Applying Z scores in real-world scenarios for data analysis and interpretation.
- Utilizing statistical software and calculators for efficient Z score computation.
- Interpreting Z scores in the context of a normal distribution and statistical significance.
Direct Calculation Using the Z Score Formula

The most straightforward way to calculate the Z score is by using the formula: Z = (X - μ) / σ, where X is the value of the element, μ is the mean of the dataset, and σ is the standard deviation. This method requires knowledge of the mean and standard deviation of the population or sample. For example, if you want to find the Z score of a student who scored 85 on a test with a mean of 80 and a standard deviation of 5, you would calculate Z = (85 - 80) / 5 = 1. This means the student’s score is 1 standard deviation above the mean.
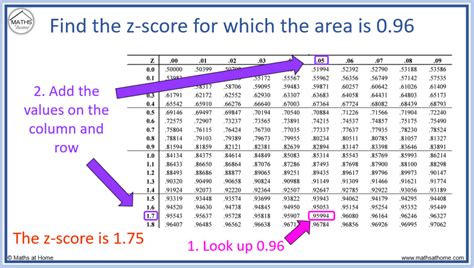
Using a Z Table or Standard Normal Distribution Table
A Z table, also known as a standard normal distribution table, is a statistical table used to find the probability that a statistic is observed given a Z score. While primarily used for finding probabilities, a Z table can indirectly help in understanding and calculating Z scores by providing the area under the standard normal curve to the left of a given Z score. This method is particularly useful for hypothesis testing and understanding the distribution of data.
Utilizing Statistical Software or Calculators

Statistical software and calculators, such as R, Python libraries (e.g., NumPy, pandas), or graphing calculators (e.g., TI-84), offer efficient ways to calculate Z scores. These tools often have built-in functions or commands that can compute Z scores directly from the data, eliminating the need for manual calculation. For instance, in Python, you can use the scipy.stats module to calculate Z scores for a dataset. This approach is especially useful when dealing with large datasets or performing complex statistical analyses.
Employing Online Z Score Calculators
For quick calculations or when detailed statistical software is not available, online Z score calculators can be a convenient option. These web-based tools typically require input of the value, mean, and standard deviation, and then calculate the Z score instantly. They are useful for educational purposes, quick data analysis, or when accessing more advanced statistical tools is not feasible.
Standardizing Data in Datasets
In some cases, particularly in data preprocessing for machine learning models, standardizing data (converting it into Z scores) is a necessary step. This process involves subtracting the mean and then dividing by the standard deviation for each data point. The result is a dataset where all features are on the same scale, which can improve the performance of certain algorithms. This method of getting Z scores is more about data transformation than calculation but is a critical application of the Z score concept in data science.
| Calculation Method | Description |
|---|---|
| Direct Formula | Using the Z = (X - μ) / σ formula for individual values. |
| Z Table | Indirectly using a standard normal distribution table for probability assessments. |
| Statistical Software | Utilizing software like R or Python for efficient computation. |
| Online Calculators | Web-based tools for quick Z score calculations. |
| Data Standardization | Converting entire datasets into Z scores for data preprocessing. |

What is the primary use of the Z score in statistics?
+The primary use of the Z score is to determine how many standard deviations an element is from the mean. It helps in understanding the relative position of a data point within a dataset and is crucial for hypothesis testing, confidence intervals, and comparing data points from different normal distributions.
Can Z scores be used for non-normal distributions?
+While Z scores are typically associated with normal distributions, they can be used as an approximation for other distributions under certain conditions, especially when the sample size is large. However, for non-normal distributions, other standardized measures or transformations might be more appropriate.
How do I choose the right method for calculating Z scores?
+The choice of method depends on the specific requirements of your analysis, the tools available to you, and the nature of your data. For quick calculations or educational purposes, online calculators or direct formula application might be sufficient. For more complex analyses or large datasets, utilizing statistical software is often the most efficient approach.