The Chi Square distribution table, also known as the Chi Square distribution chart or Chi Square table, is a statistical tool used to determine the critical value of the Chi Square statistic for a given degree of freedom and level of significance. This table is essential in hypothesis testing, particularly in tests involving categorical data, such as the Chi Square test of independence, goodness of fit tests, and tests for homogeneity of proportions.
Understanding the Chi Square Distribution

The Chi Square distribution is a continuous probability distribution that is commonly used in inferential statistics. It is defined as the sum of the squares of k independent standard normal variables, where k represents the degrees of freedom. The distribution is asymmetric, and its shape varies depending on the degrees of freedom. For small degrees of freedom, the distribution is skewed to the right, but as the degrees of freedom increase, the distribution becomes more symmetric and approaches a normal distribution.
Interpreting the Chi Square Distribution Table
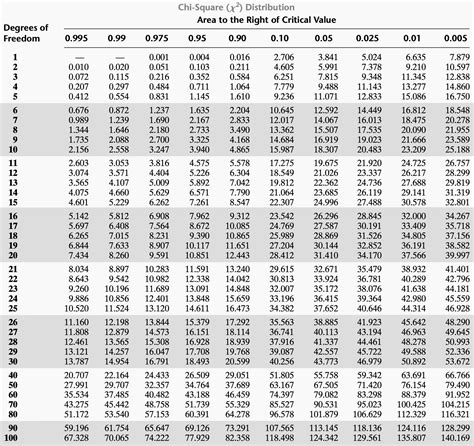
The Chi Square distribution table typically consists of rows representing different degrees of freedom and columns representing different levels of significance (usually denoted as alpha, α). The cell at the intersection of a particular row and column contains the critical Chi Square value for that degree of freedom and level of significance. To use the table, one must first determine the degrees of freedom relevant to the test being performed and the desired level of significance. Then, by looking up the appropriate cell in the table, the critical Chi Square value can be found.
| Degree of Freedom (k) | α = 0.10 | α = 0.05 | α = 0.01 |
|---|---|---|---|
| 1 | 2.706 | 3.841 | 6.635 |
| 2 | 4.605 | 5.991 | 9.210 |
| 3 | 6.251 | 7.815 | 11.345 |
| 4 | 7.779 | 9.488 | 13.277 |
| 5 | 9.236 | 11.070 | 15.086 |

Applications of the Chi Square Distribution Table

The Chi Square distribution table has numerous applications in statistical analysis, including:
- Test of Independence: To determine if there is a significant association between two categorical variables.
- Goodness of Fit Test: To assess how well observed data fit expected distributions.
- Tests for Homogeneity of Proportions: To compare proportions across different groups to see if they are significantly different.
Limitations and Considerations
While the Chi Square distribution table is a valuable resource, there are limitations and considerations to be aware of. For instance, the Chi Square test assumes that no more than 20% of the expected frequencies are less than 5, and all individual expected frequencies are at least 1. Violations of these assumptions can lead to inaccurate results. Additionally, the test is sensitive to sample size; large samples can result in statistically significant findings even when the practical significance is minimal.
Key Points
- The Chi Square distribution table is used to find critical values for hypothesis tests involving categorical data.
- The distribution is characterized by its degree of freedom and level of significance.
- The table is crucial for determining statistical significance in tests such as independence, goodness of fit, and homogeneity of proportions.
- Interpretation of the table requires understanding the degrees of freedom and the chosen level of significance.
- Limitations include assumptions about expected frequencies and sensitivity to sample size.
What is the primary use of the Chi Square distribution table in statistics?
+The primary use of the Chi Square distribution table is to determine the critical value of the Chi Square statistic for a given degree of freedom and level of significance, which is essential in hypothesis testing involving categorical data.
How do you interpret the degrees of freedom in the context of the Chi Square distribution?
+The degrees of freedom in the Chi Square distribution reflect the number of independent observations or the number of categories minus one in many tests. It is crucial for selecting the correct critical value from the Chi Square distribution table.
What are the common applications of the Chi Square distribution table in statistical analysis?
+Common applications include tests of independence, goodness of fit tests, and tests for homogeneity of proportions, all of which involve comparing observed frequencies to expected frequencies under a null hypothesis.